Window
Description
The Window object is implemented in xscale.window, which
uses the decorator xarray.register_dataarray_accessor to
associate a window to a DataArray. The Window object
extends xarray.DataArray.rolling to multi-dimensional arrays and
benefits from the power of dask.array for multi-processing
computation. As an example, a 3-dimensional testing DataArray is loaded
from the generator:
In [1]: import xscale.signal.generator as xgen

In [2]: foo = xgen.example_xyt()

In [3]: foo
Out[3]:
<xarray.DataArray 'example_xyt' (time: 100, y: 128, x: 128)>
dask.array<shape=(100, 128, 128), dtype=float64, chunksize=(50, 70, 70)>
Coordinates:
  * time     (time) datetime64[ns] 2011-01-01 2011-01-02 2011-01-03 ...
  * y        (y) float64 0.0 0.04947 0.09895 0.1484 0.1979 0.2474 0.2968 ...
  * x        (x) float64 0.0 0.04947 0.09895 0.1484 0.1979 0.2474 0.2968 ...
In [4]: foo.isel(y=40, x=40).plot()
Out[4]: [<matplotlib.lines.Line2D at 0x7f15d1b37650>]

In [5]: plt.show()

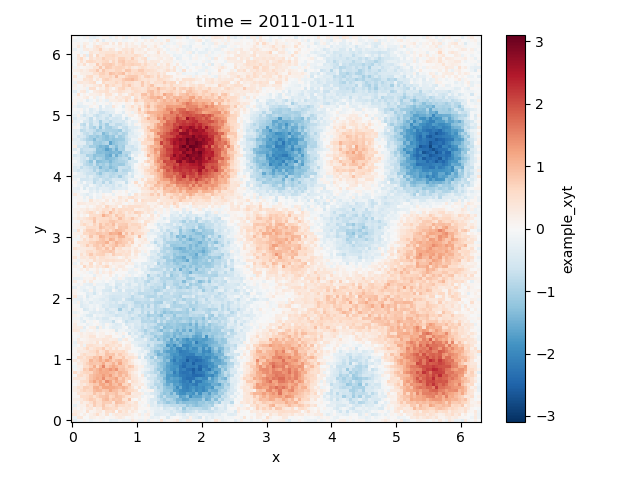
In [6]: foo.isel(time=10).plot()
Out[6]: <matplotlib.collections.QuadMesh at 0x7f15d17c2810>

In [7]: plt.show()
The Window object may be simply linked to the latter DataArray using
the attribute .window:
In [8]: import xscale

In [9]: wt = foo.window
Defining
The xscale.Window.set() method takes optionally six parameters:
n: the size of the windowdim: dimension names for each axis (e.g.,('x', 'y', 'z')).dx: the sampling along the dimensionscutoff: the cutoff of the window, used for defining window for linear filtering.window: the name of the window used, and other window parameters passed through a tuplechunk: set or modify the chunks of thedask.arrayobject associated to thexarray.DataArray
Note
There is no need to define dim if the other parameters are passed as
dictionaries.
In [10]: wt.set()
Once a Window is set, one can check the status of the Window usìng
In [11]: print(wt)
Window [order->{'y': 128, 'x': 128, 'time': 100}, cutoff->{'y': None, 'x': None, 'time': None}, dx->{'y': 0.049473900056532176, 'x': 0.049473900056532176, 'time': 86400.0}, window->{'y': 'boxcar', 'x': 'boxcar', 'time': 'boxcar'}]
If the cutoff parameter is not defined the
scipy.signal.get_window() is used to build the window along each
dimensions passed through the other parameters.
In [12]: wt.set(n=20, dim='time', window='boxcar')

In [13]: wt.plot()

AttributeErrorTraceback (most recent call last)
<ipython-input-13-046eb6c03005> in <module>()
----> 1 wt.plot()

/home/docs/checkouts/readthedocs.org/user_builds/xscale/conda/latest/lib/python2.7/site-packages/xscale-0.1.dev0+33.g2de2283-py2.7.egg/xscale/filtering/linearfilters.pyc in plot(self)
    283 		win_spectrum_norm = 20 * log10(win_spectrum / abs(win_spectrum).max())
    284 		if self.ndim == 1:
--> 285 			_plot1d_window(win_array, win_spectrum_norm)
    286 		elif self.ndim == 2:
    287 			_plot2d_window(win_array, win_spectrum_norm)

/home/docs/checkouts/readthedocs.org/user_builds/xscale/conda/latest/lib/python2.7/site-packages/xscale-0.1.dev0+33.g2de2283-py2.7.egg/xscale/filtering/linearfilters.pyc in _plot1d_window(win_array, win_spectrum_norm)
    296 	freq = win_spectrum_norm[dim]
    297 	min_freq = np.extract(freq > 0, freq).min()
--> 298 	cutoff_3db = 1. / abs(freq[np.argmin(np.abs(win_spectrum_norm + 3))])
    299 	cutoff_6db = 1. / abs(freq[np.argmin(np.abs(win_spectrum_norm + 6))])
    300

/home/docs/checkouts/readthedocs.org/user_builds/xscale/conda/latest/lib/python2.7/site-packages/xarray/core/dataarray.pyc in __getitem__(self, key)
    472         else:
    473             # xarray-style array indexing
--> 474             return self.isel(indexers=self._item_key_to_dict(key))
    475
    476     def __setitem__(self, key, value):

/home/docs/checkouts/readthedocs.org/user_builds/xscale/conda/latest/lib/python2.7/site-packages/xarray/core/dataarray.pyc in isel(self, indexers, drop, **indexers_kwargs)
    754         """
    755         indexers = either_dict_or_kwargs(indexers, indexers_kwargs, 'isel')
--> 756         ds = self._to_temp_dataset().isel(drop=drop, indexers=indexers)
    757         return self._from_temp_dataset(ds)
    758

/home/docs/checkouts/readthedocs.org/user_builds/xscale/conda/latest/lib/python2.7/site-packages/xarray/core/dataset.pyc in isel(self, indexers, drop, **indexers_kwargs)
   1425         for name, var in iteritems(self._variables):
   1426             var_indexers = {k: v for k, v in indexers_list if k in var.dims}
-> 1427             new_var = var.isel(indexers=var_indexers)
   1428             if not (drop and name in var_indexers):
   1429                 variables[name] = new_var

/home/docs/checkouts/readthedocs.org/user_builds/xscale/conda/latest/lib/python2.7/site-packages/xarray/core/variable.pyc in isel(self, indexers, drop, **indexers_kwargs)
    852             if dim in indexers:
    853                 key[i] = indexers[dim]
--> 854         return self[tuple(key)]
    855
    856     def squeeze(self, dim=None):

/home/docs/checkouts/readthedocs.org/user_builds/xscale/conda/latest/lib/python2.7/site-packages/xarray/core/variable.pyc in __getitem__(self, key)
    618         array `x.values` directly.
    619         """
--> 620         dims, indexer, new_order = self._broadcast_indexes(key)
    621         data = as_indexable(self._data)[indexer]
    622         if new_order:

/home/docs/checkouts/readthedocs.org/user_builds/xscale/conda/latest/lib/python2.7/site-packages/xarray/core/variable.pyc in _broadcast_indexes(self, key)
    462         key = tuple(
    463             k.data.item() if isinstance(k, Variable) and k.ndim == 0 else k
--> 464             for k in key)
    465         # Convert a 0d-array to an integer
    466         key = tuple(

/home/docs/checkouts/readthedocs.org/user_builds/xscale/conda/latest/lib/python2.7/site-packages/xarray/core/variable.pyc in <genexpr>((k,))
    462         key = tuple(
    463             k.data.item() if isinstance(k, Variable) and k.ndim == 0 else k
--> 464             for k in key)
    465         # Convert a 0d-array to an integer
    466         key = tuple(

AttributeError: 'Array' object has no attribute 'item'

In [14]: plt.show()

If the cutoff parameter is defined, the scipy.signal.get_window()
is used to generate a Finite Impulse Response filter based on the cutoff and
in respect of the window properties:
In [15]: cutoff_10d = 10 # A 10-day cutoff

In [16]: dx_1d = 1 # Define the sampling period (one day)

In [17]: wt.set(n=20, dim='time', cutoff=cutoff_10d, dx=dx_1d, window='boxcar')

In [18]: wt.plot()

AttributeErrorTraceback (most recent call last)
<ipython-input-18-046eb6c03005> in <module>()
----> 1 wt.plot()

/home/docs/checkouts/readthedocs.org/user_builds/xscale/conda/latest/lib/python2.7/site-packages/xscale-0.1.dev0+33.g2de2283-py2.7.egg/xscale/filtering/linearfilters.pyc in plot(self)
    283 		win_spectrum_norm = 20 * log10(win_spectrum / abs(win_spectrum).max())
    284 		if self.ndim == 1:
--> 285 			_plot1d_window(win_array, win_spectrum_norm)
    286 		elif self.ndim == 2:
    287 			_plot2d_window(win_array, win_spectrum_norm)

/home/docs/checkouts/readthedocs.org/user_builds/xscale/conda/latest/lib/python2.7/site-packages/xscale-0.1.dev0+33.g2de2283-py2.7.egg/xscale/filtering/linearfilters.pyc in _plot1d_window(win_array, win_spectrum_norm)
    296 	freq = win_spectrum_norm[dim]
    297 	min_freq = np.extract(freq > 0, freq).min()
--> 298 	cutoff_3db = 1. / abs(freq[np.argmin(np.abs(win_spectrum_norm + 3))])
    299 	cutoff_6db = 1. / abs(freq[np.argmin(np.abs(win_spectrum_norm + 6))])
    300

/home/docs/checkouts/readthedocs.org/user_builds/xscale/conda/latest/lib/python2.7/site-packages/xarray/core/dataarray.pyc in __getitem__(self, key)
    472         else:
    473             # xarray-style array indexing
--> 474             return self.isel(indexers=self._item_key_to_dict(key))
    475
    476     def __setitem__(self, key, value):

/home/docs/checkouts/readthedocs.org/user_builds/xscale/conda/latest/lib/python2.7/site-packages/xarray/core/dataarray.pyc in isel(self, indexers, drop, **indexers_kwargs)
    754         """
    755         indexers = either_dict_or_kwargs(indexers, indexers_kwargs, 'isel')
--> 756         ds = self._to_temp_dataset().isel(drop=drop, indexers=indexers)
    757         return self._from_temp_dataset(ds)
    758

/home/docs/checkouts/readthedocs.org/user_builds/xscale/conda/latest/lib/python2.7/site-packages/xarray/core/dataset.pyc in isel(self, indexers, drop, **indexers_kwargs)
   1425         for name, var in iteritems(self._variables):
   1426             var_indexers = {k: v for k, v in indexers_list if k in var.dims}
-> 1427             new_var = var.isel(indexers=var_indexers)
   1428             if not (drop and name in var_indexers):
   1429                 variables[name] = new_var

/home/docs/checkouts/readthedocs.org/user_builds/xscale/conda/latest/lib/python2.7/site-packages/xarray/core/variable.pyc in isel(self, indexers, drop, **indexers_kwargs)
    852             if dim in indexers:
    853                 key[i] = indexers[dim]
--> 854         return self[tuple(key)]
    855
    856     def squeeze(self, dim=None):

/home/docs/checkouts/readthedocs.org/user_builds/xscale/conda/latest/lib/python2.7/site-packages/xarray/core/variable.pyc in __getitem__(self, key)
    618         array `x.values` directly.
    619         """
--> 620         dims, indexer, new_order = self._broadcast_indexes(key)
    621         data = as_indexable(self._data)[indexer]
    622         if new_order:

/home/docs/checkouts/readthedocs.org/user_builds/xscale/conda/latest/lib/python2.7/site-packages/xarray/core/variable.pyc in _broadcast_indexes(self, key)
    462         key = tuple(
    463             k.data.item() if isinstance(k, Variable) and k.ndim == 0 else k
--> 464             for k in key)
    465         # Convert a 0d-array to an integer
    466         key = tuple(

/home/docs/checkouts/readthedocs.org/user_builds/xscale/conda/latest/lib/python2.7/site-packages/xarray/core/variable.pyc in <genexpr>((k,))
    462         key = tuple(
    463             k.data.item() if isinstance(k, Variable) and k.ndim == 0 else k
--> 464             for k in key)
    465         # Convert a 0d-array to an integer
    466         key = tuple(

AttributeError: 'Array' object has no attribute 'item'

In [19]: plt.show()

Note
Every time one uses the xscale.Window.set() method, all the
window parameters are automatically reset.
- There are several default options that allow a flexible use of
Window. By - default, if no
nargument is passed, the total length fo the corresponding dimensions are taken. This latter option is useful to taper the entire data along one dimension with a window.
Plotting
Plotting the window is useful to check its physical and spectral properties.
For 1-dimensional and 2-dimensional windows, the plot function can be used
to display the weight distribution as well as the spectral response of the
window. The cutoff periods for -3 dB and -6 dB damping and are very useful to
assess the selectivity of the window.
For one-dimensional window:
In [20]: wt.set(n=20, dim='time', cutoff=cutoff_10d, dx=dx_1d, window='hanning')

In [21]: wt.plot()

AttributeErrorTraceback (most recent call last)
<ipython-input-21-046eb6c03005> in <module>()
----> 1 wt.plot()

/home/docs/checkouts/readthedocs.org/user_builds/xscale/conda/latest/lib/python2.7/site-packages/xscale-0.1.dev0+33.g2de2283-py2.7.egg/xscale/filtering/linearfilters.pyc in plot(self)
    283 		win_spectrum_norm = 20 * log10(win_spectrum / abs(win_spectrum).max())
    284 		if self.ndim == 1:
--> 285 			_plot1d_window(win_array, win_spectrum_norm)
    286 		elif self.ndim == 2:
    287 			_plot2d_window(win_array, win_spectrum_norm)

/home/docs/checkouts/readthedocs.org/user_builds/xscale/conda/latest/lib/python2.7/site-packages/xscale-0.1.dev0+33.g2de2283-py2.7.egg/xscale/filtering/linearfilters.pyc in _plot1d_window(win_array, win_spectrum_norm)
    296 	freq = win_spectrum_norm[dim]
    297 	min_freq = np.extract(freq > 0, freq).min()
--> 298 	cutoff_3db = 1. / abs(freq[np.argmin(np.abs(win_spectrum_norm + 3))])
    299 	cutoff_6db = 1. / abs(freq[np.argmin(np.abs(win_spectrum_norm + 6))])
    300

/home/docs/checkouts/readthedocs.org/user_builds/xscale/conda/latest/lib/python2.7/site-packages/xarray/core/dataarray.pyc in __getitem__(self, key)
    472         else:
    473             # xarray-style array indexing
--> 474             return self.isel(indexers=self._item_key_to_dict(key))
    475
    476     def __setitem__(self, key, value):

/home/docs/checkouts/readthedocs.org/user_builds/xscale/conda/latest/lib/python2.7/site-packages/xarray/core/dataarray.pyc in isel(self, indexers, drop, **indexers_kwargs)
    754         """
    755         indexers = either_dict_or_kwargs(indexers, indexers_kwargs, 'isel')
--> 756         ds = self._to_temp_dataset().isel(drop=drop, indexers=indexers)
    757         return self._from_temp_dataset(ds)
    758

/home/docs/checkouts/readthedocs.org/user_builds/xscale/conda/latest/lib/python2.7/site-packages/xarray/core/dataset.pyc in isel(self, indexers, drop, **indexers_kwargs)
   1425         for name, var in iteritems(self._variables):
   1426             var_indexers = {k: v for k, v in indexers_list if k in var.dims}
-> 1427             new_var = var.isel(indexers=var_indexers)
   1428             if not (drop and name in var_indexers):
   1429                 variables[name] = new_var

/home/docs/checkouts/readthedocs.org/user_builds/xscale/conda/latest/lib/python2.7/site-packages/xarray/core/variable.pyc in isel(self, indexers, drop, **indexers_kwargs)
    852             if dim in indexers:
    853                 key[i] = indexers[dim]
--> 854         return self[tuple(key)]
    855
    856     def squeeze(self, dim=None):

/home/docs/checkouts/readthedocs.org/user_builds/xscale/conda/latest/lib/python2.7/site-packages/xarray/core/variable.pyc in __getitem__(self, key)
    618         array `x.values` directly.
    619         """
--> 620         dims, indexer, new_order = self._broadcast_indexes(key)
    621         data = as_indexable(self._data)[indexer]
    622         if new_order:

/home/docs/checkouts/readthedocs.org/user_builds/xscale/conda/latest/lib/python2.7/site-packages/xarray/core/variable.pyc in _broadcast_indexes(self, key)
    462         key = tuple(
    463             k.data.item() if isinstance(k, Variable) and k.ndim == 0 else k
--> 464             for k in key)
    465         # Convert a 0d-array to an integer
    466         key = tuple(

/home/docs/checkouts/readthedocs.org/user_builds/xscale/conda/latest/lib/python2.7/site-packages/xarray/core/variable.pyc in <genexpr>((k,))
    462         key = tuple(
    463             k.data.item() if isinstance(k, Variable) and k.ndim == 0 else k
--> 464             for k in key)
    465         # Convert a 0d-array to an integer
    466         key = tuple(

AttributeError: 'Array' object has no attribute 'item'

In [22]: plt.show()

For two-dimensional window:
In [23]: ws = foo.window

In [24]: ws.set(n={'x': 10, 'y': 15}, window={'x':'hanning', 'y':('tukey', 0.25)})

In [25]: ws.plot()

AttributeErrorTraceback (most recent call last)
<ipython-input-25-b4029634a100> in <module>()
----> 1 ws.plot()

/home/docs/checkouts/readthedocs.org/user_builds/xscale/conda/latest/lib/python2.7/site-packages/xscale-0.1.dev0+33.g2de2283-py2.7.egg/xscale/filtering/linearfilters.pyc in plot(self)
    285 			_plot1d_window(win_array, win_spectrum_norm)
    286 		elif self.ndim == 2:
--> 287 			_plot2d_window(win_array, win_spectrum_norm)
    288 		else:
    289 			raise ValueError("This number of dimension is not supported by the "

/home/docs/checkouts/readthedocs.org/user_builds/xscale/conda/latest/lib/python2.7/site-packages/xscale-0.1.dev0+33.g2de2283-py2.7.egg/xscale/filtering/linearfilters.pyc in _plot2d_window(win_array, win_spectrum_norm)
    338 	min_freq_y = np.extract(freq_y > 0, freq_y).min()
    339
--> 340 	cutoff_x_3db = 1. / abs(freq_x[np.argmin(np.abs(win_spectrum_x + 3))])
    341 	cutoff_x_6db = 1. / abs(freq_x[np.argmin(np.abs(win_spectrum_x + 6))])
    342 	cutoff_y_3db = 1. / abs(freq_y[np.argmin(np.abs(win_spectrum_y + 3))])

/home/docs/checkouts/readthedocs.org/user_builds/xscale/conda/latest/lib/python2.7/site-packages/xarray/core/dataarray.pyc in __getitem__(self, key)
    472         else:
    473             # xarray-style array indexing
--> 474             return self.isel(indexers=self._item_key_to_dict(key))
    475
    476     def __setitem__(self, key, value):

/home/docs/checkouts/readthedocs.org/user_builds/xscale/conda/latest/lib/python2.7/site-packages/xarray/core/dataarray.pyc in isel(self, indexers, drop, **indexers_kwargs)
    754         """
    755         indexers = either_dict_or_kwargs(indexers, indexers_kwargs, 'isel')
--> 756         ds = self._to_temp_dataset().isel(drop=drop, indexers=indexers)
    757         return self._from_temp_dataset(ds)
    758

/home/docs/checkouts/readthedocs.org/user_builds/xscale/conda/latest/lib/python2.7/site-packages/xarray/core/dataset.pyc in isel(self, indexers, drop, **indexers_kwargs)
   1425         for name, var in iteritems(self._variables):
   1426             var_indexers = {k: v for k, v in indexers_list if k in var.dims}
-> 1427             new_var = var.isel(indexers=var_indexers)
   1428             if not (drop and name in var_indexers):
   1429                 variables[name] = new_var

/home/docs/checkouts/readthedocs.org/user_builds/xscale/conda/latest/lib/python2.7/site-packages/xarray/core/variable.pyc in isel(self, indexers, drop, **indexers_kwargs)
    852             if dim in indexers:
    853                 key[i] = indexers[dim]
--> 854         return self[tuple(key)]
    855
    856     def squeeze(self, dim=None):

/home/docs/checkouts/readthedocs.org/user_builds/xscale/conda/latest/lib/python2.7/site-packages/xarray/core/variable.pyc in __getitem__(self, key)
    618         array `x.values` directly.
    619         """
--> 620         dims, indexer, new_order = self._broadcast_indexes(key)
    621         data = as_indexable(self._data)[indexer]
    622         if new_order:

/home/docs/checkouts/readthedocs.org/user_builds/xscale/conda/latest/lib/python2.7/site-packages/xarray/core/variable.pyc in _broadcast_indexes(self, key)
    462         key = tuple(
    463             k.data.item() if isinstance(k, Variable) and k.ndim == 0 else k
--> 464             for k in key)
    465         # Convert a 0d-array to an integer
    466         key = tuple(

/home/docs/checkouts/readthedocs.org/user_builds/xscale/conda/latest/lib/python2.7/site-packages/xarray/core/variable.pyc in <genexpr>((k,))
    462         key = tuple(
    463             k.data.item() if isinstance(k, Variable) and k.ndim == 0 else k
--> 464             for k in key)
    465         # Convert a 0d-array to an integer
    466         key = tuple(

AttributeError: 'Array' object has no attribute 'item'

In [26]: plt.show()

Note
The plot function will not work for windows with more than 2 dimensions.
Convolution
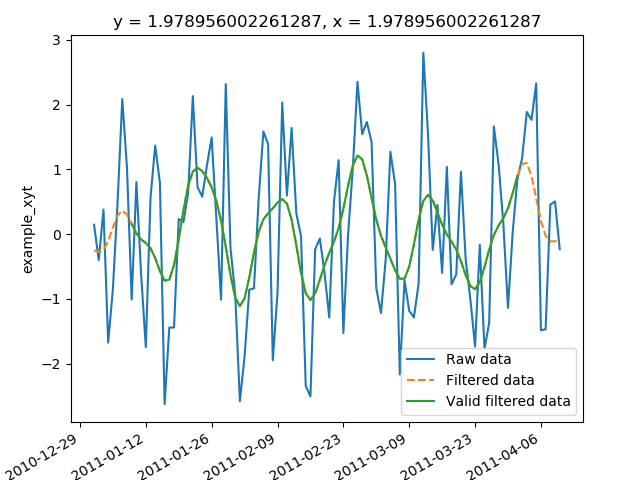
The designed window can be then used to filter the data using a
multi-dimensional convolution by calling the
xarray.DataArray.Window.convolve() method. When this method is
called the dask graph is implemented by mapping and ghosting the
scipy.ndimage.convolve() function.
In [27]: wt.set(n=20, dim='time', cutoff=cutoff_10d, dx=dx_1d, window='hanning')

In [28]: res = wt.convolve()

In [29]: res_valid = wt.convolve(trim=True)
In [30]: foo.isel(y=40, x=40).plot(label="Raw data")
Out[30]: [<matplotlib.lines.Line2D at 0x7f15d15d8e10>]

In [31]: res.isel(y=40, x=40).plot(label="Filtered data", ls="--")
Out[31]: [<matplotlib.lines.Line2D at 0x7f15d154cf50>]

In [32]: res_valid.isel(y=40, x=40).plot(label="Valid filtered data")
Out[32]: [<matplotlib.lines.Line2D at 0x7f15d161d050>]

In [33]: plt.legend()
Out[33]: <matplotlib.legend.Legend at 0x7f15d162c690>

In [34]: plt.show()
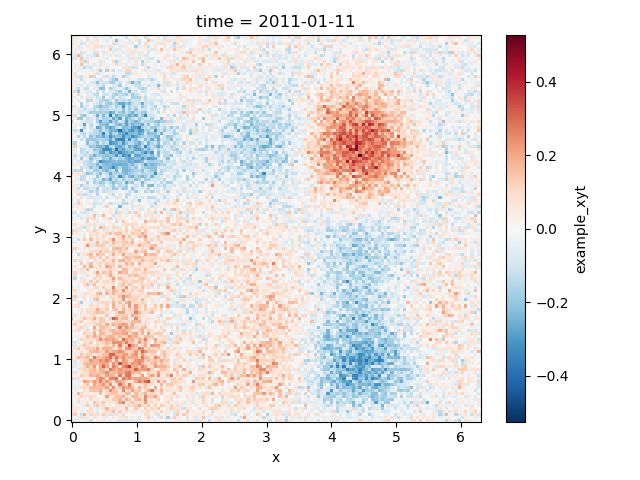
The application of the two-dimensional window ̀ ws` gives the following filtered data:
In [35]: res2 = ws.convolve()

In [36]: res2.isel(time=10).plot()
Out[36]: <matplotlib.collections.QuadMesh at 0x7f15d1627c50>

In [37]: plt.show()
Note
If the keyword parameter compute is set to True, the computation
will be performed and a progress bar will be displayed.
The xarray.DataArray.Window can be applied on dataset with missing
values such as land areas for oceanographic data. In this case, the filter
weights are normalized to take into account only valid data. In general,
such a normalization is applied by computing the low-passed data \(Y_{LP}\):
where \(Y\) is the raw data, \(W\) the window used, and \(M\) a mask that is 1 for valid data and 0 for missing values.
In [38]: import xscale.signal.generator as xgen

In [39]: foo = xgen.example_xyt(boundaries=True)
In [40]: foo.isel(time=10).plot()
Out[40]: <matplotlib.collections.QuadMesh at 0x7f15d175bad0>

In [41]: plt.show()

In [42]: ws = foo.window

In [43]: ws.set(n={'x': 10, 'y': 15}, window={'x':'hanning', 'y':('tukey', 0.25)})

In [44]: weights = ws.boundary_weights(drop_dims=['time'])

TypeErrorTraceback (most recent call last)
<ipython-input-44-e12b93d2615f> in <module>()
----> 1 weights = ws.boundary_weights(drop_dims=['time'])

/home/docs/checkouts/readthedocs.org/user_builds/xscale/conda/latest/lib/python2.7/site-packages/xscale-0.1.dev0+33.g2de2283-py2.7.egg/xscale/filtering/linearfilters.pyc in boundary_weights(self, mode, mask, drop_dims, compute)
    225 		if drop_dims:
    226 			new_coeffs = da.squeeze(coeffs, axis=[self.obj.get_axis_num(di)
--> 227 		                                          for di in drop_dims])
    228 		else:
    229 			new_coeffs = coeffs

/home/docs/checkouts/readthedocs.org/user_builds/xscale/conda/latest/lib/python2.7/site-packages/dask/array/routines.pyc in squeeze(a, axis)
    933         axis = (axis,)
    934
--> 935     if any(a.shape[i] != 1 for i in axis):
    936         raise ValueError("cannot squeeze axis with size other than one")
    937

/home/docs/checkouts/readthedocs.org/user_builds/xscale/conda/latest/lib/python2.7/site-packages/dask/array/routines.pyc in <genexpr>((i,))
    933         axis = (axis,)
    934
--> 935     if any(a.shape[i] != 1 for i in axis):
    936         raise ValueError("cannot squeeze axis with size other than one")
    937

TypeError: tuple indices must be integers, not list

In [45]: weights.plot(vmin=0.8, vmax=1.)

NameErrorTraceback (most recent call last)
<ipython-input-45-f62f4a52776d> in <module>()
----> 1 weights.plot(vmin=0.8, vmax=1.)

NameError: name 'weights' is not defined

In [46]: plt.show()

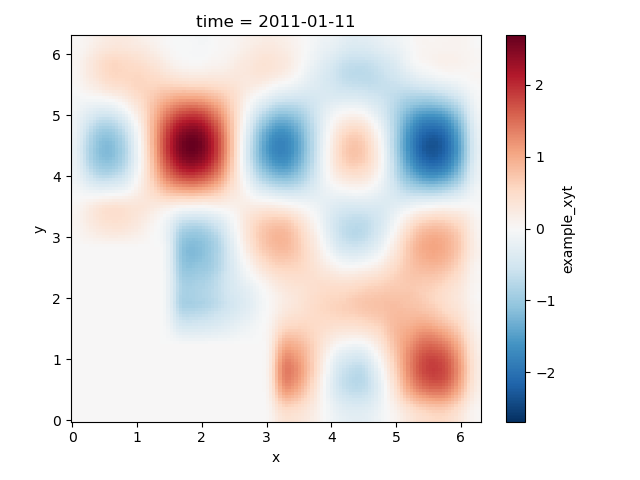
Without the use of boundary weights:
In [47]: res_raw = ws.convolve()

In [48]: res_raw.isel(time=10).plot()
Out[48]: <matplotlib.collections.QuadMesh at 0x7f16033def10>

In [49]: plt.show()
With the use of boundary weights:
In [50]: res_weights = ws.convolve(weights=weights)

NameErrorTraceback (most recent call last)
<ipython-input-50-f94e265343e2> in <module>()
----> 1 res_weights = ws.convolve(weights=weights)

NameError: name 'weights' is not defined

In [51]: res_weights.isel(time=10).plot()

NameErrorTraceback (most recent call last)
<ipython-input-51-f80354627d4d> in <module>()
----> 1 res_weights.isel(time=10).plot()

NameError: name 'res_weights' is not defined

In [52]: plt.show()

Note
Once a filtering has been performed, the current DataArray the
dask graph is destroyed and need to be created again using the
xscale.Window.set() method.
Tapering
This functionality is not coded yet but it will be available soon.